Monitoring Kubernetes with the AppDynamics Cluster Agent
At Application Performance, as independent application performance specialists, we take a keen interest in the capabilities of the major APM vendors. When it comes to monitoring Kubernetes in particular, application performance management (APM) tools like AppDynamics are a great option.
The offerings of major APM vendors tend to follow the proven trends in the market. One major trend these days is the adoption of all things cloud, especially micro-services and Kubernetes.
What is Kubernetes?
If “software is eating the world”, then Kubernetes, or K8s, is eating the container-orchestration part of it. Kubernetes promises cloud-vendor-neutral deployment and auto-scaling of your applications, relieving you of the operational burden and instead allowing you to concentrate on innovation. Or at least that’s the theory.
But by most measures Kubernetes is complicated, especially when there are a large number of micro-services and even more interconnections, so it’s important that the APM tools can help visualise what’s going on and identify problems quickly. This is where AppDynamics can help.
How AppDynamics can help
In some respects, AppDynamics has been playing catch-up when it comes to monitoring and visualising Kubernetes, but it looks like they have caught up with the latest incarnation of its Kubernetes Cluster Agent. In the past, it has been necessary to deploy monitoring extensions from the AppDynamics community portal, which are basically extensions to the machine agent. Now Kubernetes and Docker are first-class citizens within the AppDynamics ecosystem.
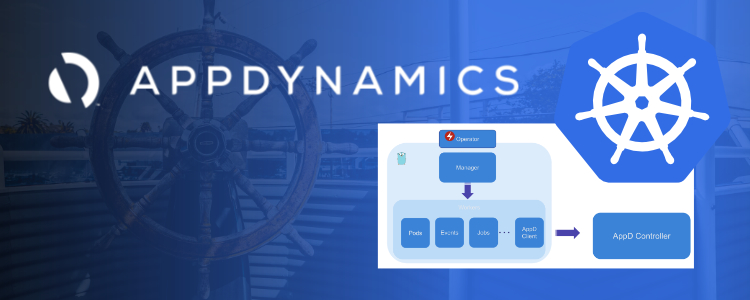
You only need one Cluster Agent per Kubernetes cluster and it consumes one server-visibility licence. You first install the AppDynamics Operator for Kubernetes and then use it to install the Cluster Agent. The Cluster Agent reports its data back to the controller. In the UI, the information is displayed in a built-in Kubernetes dashboard, under the Servers tab. For the full power of the Cluster Agent, it’s best to use it with the Kubernetes Metrics Server API, although this needs to be installed in advance.
The following screenshot of the dashboard is taken from the AppDynamics documentation site:
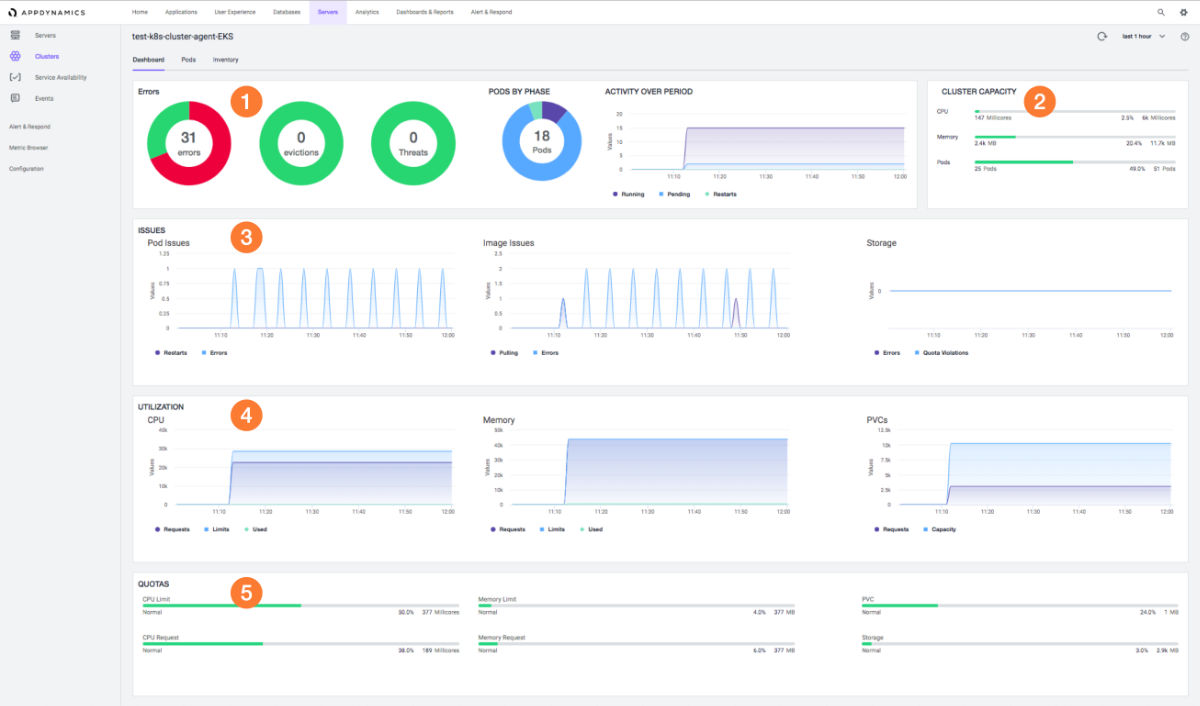
The dashboard contains widgets showing:
- Errors
- Cluster capacity
- Number of issues over time
- CPU, memory and storage utilisation over time
- Quotas for CPU, memory and persistent volume chains
Not only can the Cluster Agent report on the health of a cluster, it can automatically deploy application and server-monitoring agents within the containers, starting with Java. More agent types are in the pipeline.
Monitoring clusters with AppDynamics
Again, AppDynamics has been playing catch-up in this arena as well, but it’s definitely on the right course. Some of the competition have had this ability for a while. The deployed agents automatically discover all the relationships between the micro-services and populate the flow-maps that are the cornerstone of AppDynamics.
Find out more
Application Performance continues to work closely with AppDynamics and we’re looking forward to seeing our clients make more use of Cluster Agent to safeguard their investment in Kubernetes.
If you want to find out how AppDynamics can help your business, drop us a line. We’d love to hear from you and discuss your individual needs.