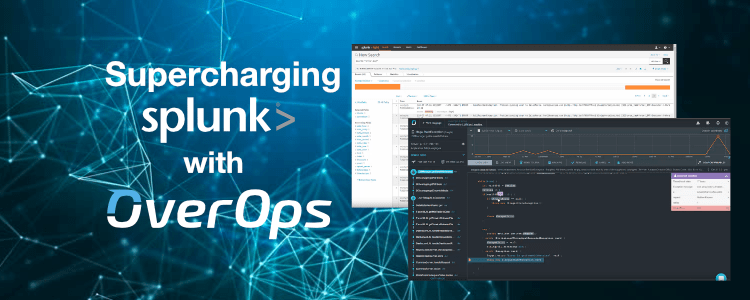
Supercharging Splunk with OverOps

OverOps has the ability to integrate with Splunk via a link that will take you to a screen showing the exact code and variables that were used in production at the time of an error.
Splunk is a log management tool which monitors the errors and exceptions that your application writes to log files. Splunk can show the error message or stack trace but often those aren’t enough for a developer to diagnose the root-cause of a problem without having to spend considerable time in a pre-production environment attempting to reproduce the issue.
In a pre-production environment, a developer can fire up a debugger and step through the source code to see the variables and their states. But sometimes, reproducing a problem can be hard, or even impossible, as you don’t know the exact input variables that occured in the production environment, that led to the error.
OverOps is like a production debugger. It gives you the source code and variable state that were used at the exact moment when the error occured in production. This means that you no longer have to spend time attempting to reproduce it, and can move straight to the fix.
From Splunk to OverOps in 1-click
To see the integration in action, watch this short video.
A similar integration is also available for AppDynamics, SumoLogic, ELK, dynatrace, New Relic and others.
OverOps can also post notifications of new errors to JIRA, Slack, HipChat or ServiceNow.
If you’d like to read up more on techniques for addressing java problems, then check out our e-book :
