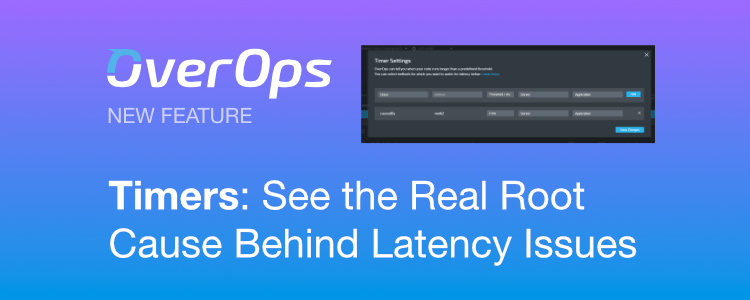
New OverOps Feature – Timers

OverOps adds a new feature to time the response time of Java Methods, alert when they exceed their targets, and see the complete source-code and variable states responsible.
See root cause information when a method’s execution time exceeds a target threshold
If you don’t know OverOps, we have written about it quite a lot recently. In short, OverOps helps you to find and fix Java errors and exceptions 90% faster by providing the Source code and Variable states from your production applications at the point where an error or exception occured.
The latest feature, Timers, allows you to add Method timing for particular methods of interest to gain visibility into latency issues.
If you choose to turn on a Timer and set a target threshold (in milliseconds) for a method, OverOps tracks the time it takes from when the method is called to when it reaches its return statement. If the execution time exceeds the given threshold, OverOps triggers an event showing the complete source code and variable state, just like you get for errors and exceptions.
Of course if you already have an APM solution in place, then you may already have this covered. The good news is that OverOps integrates with APM tools such as AppDynamics, New Relic, Dynatrace, DataDog and others. See our recent post showing OverOps integrates with AppDynamics to get a flavour of what is possible.
Not ready to start a trial yet? Why not download our FREE e-Book about Solving Java Application Errors in Production.
