DBmarlin 1.1.0 released including Host monitoring and improved Explain plans
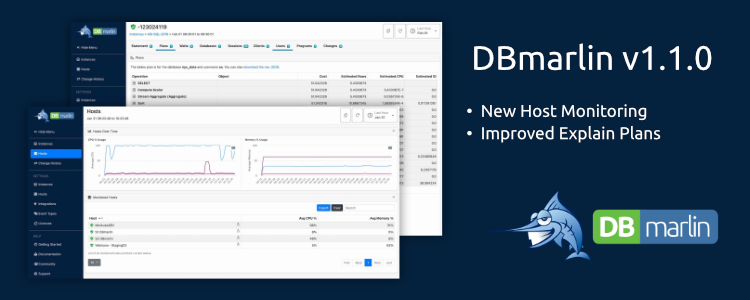
Today is another milestone for our database monitoring solution, DBmarlin, and the team here at AP towers have kept the speed of development moving apace. The latest 1.1.0 version of DBmarlin introduces yet more functionality and improvements. Below are some of the highlights:
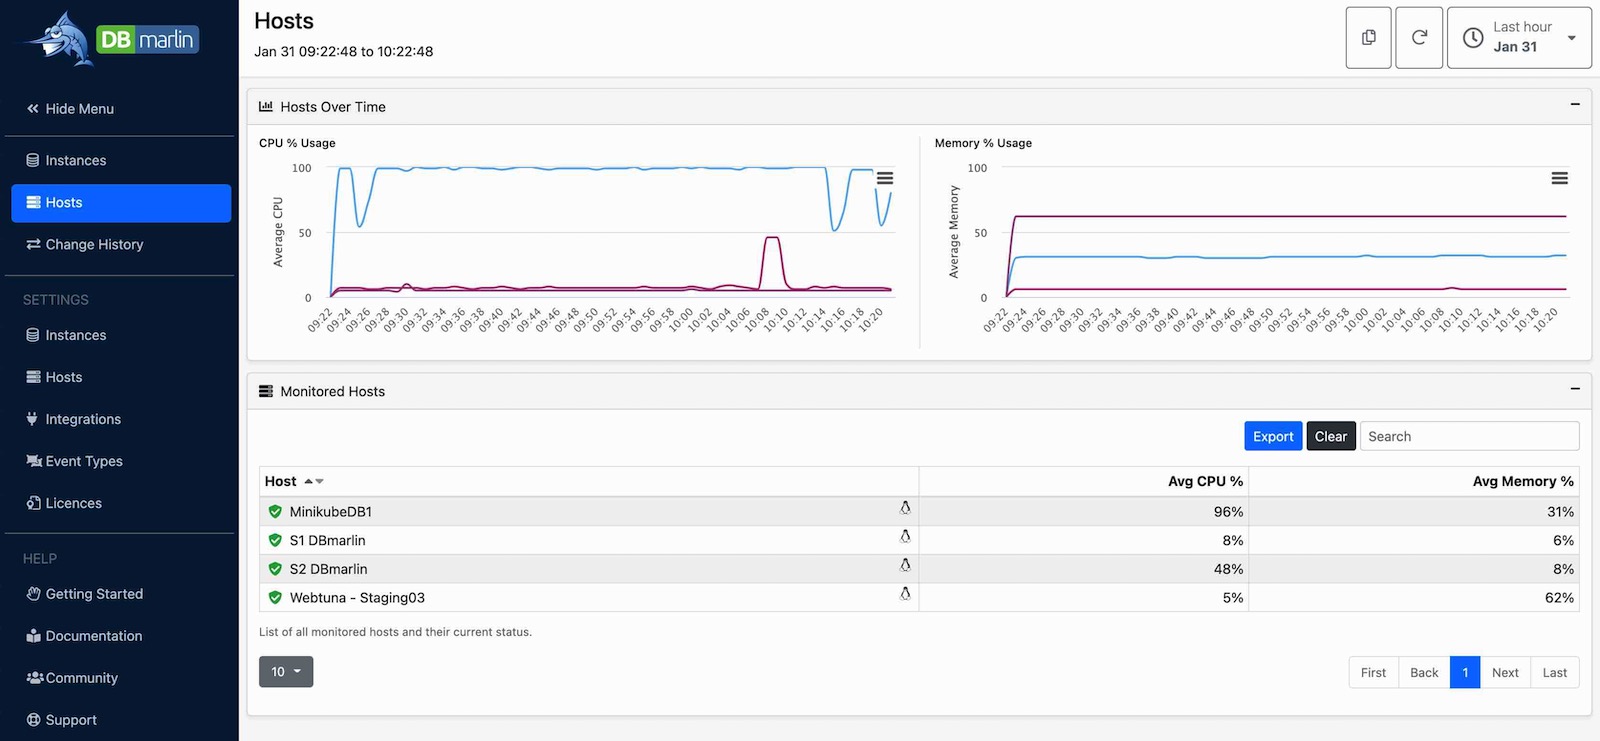
Host monitoring
Our main goal remains true to our product statement – to monitor your databases quickly and easily, but we had a gap in that we couldn’t tell if your database host servers were coping or what they were doing. This release helps address this hole, and you can now associate a host to a database instance, letting you relate host and database metrics.
This initial version covers the average CPU and memory metrics. Work is already underway to extend this to include a breakdown of CPU and memory usage alongside other vital metrics such as disk I/O and network bandwidth.
These metrics are viewable via our new Hosts screen, or via any linked database instance, which provides a quick and easy way to see how they change or any performance bottlenecks impacting your host servers.
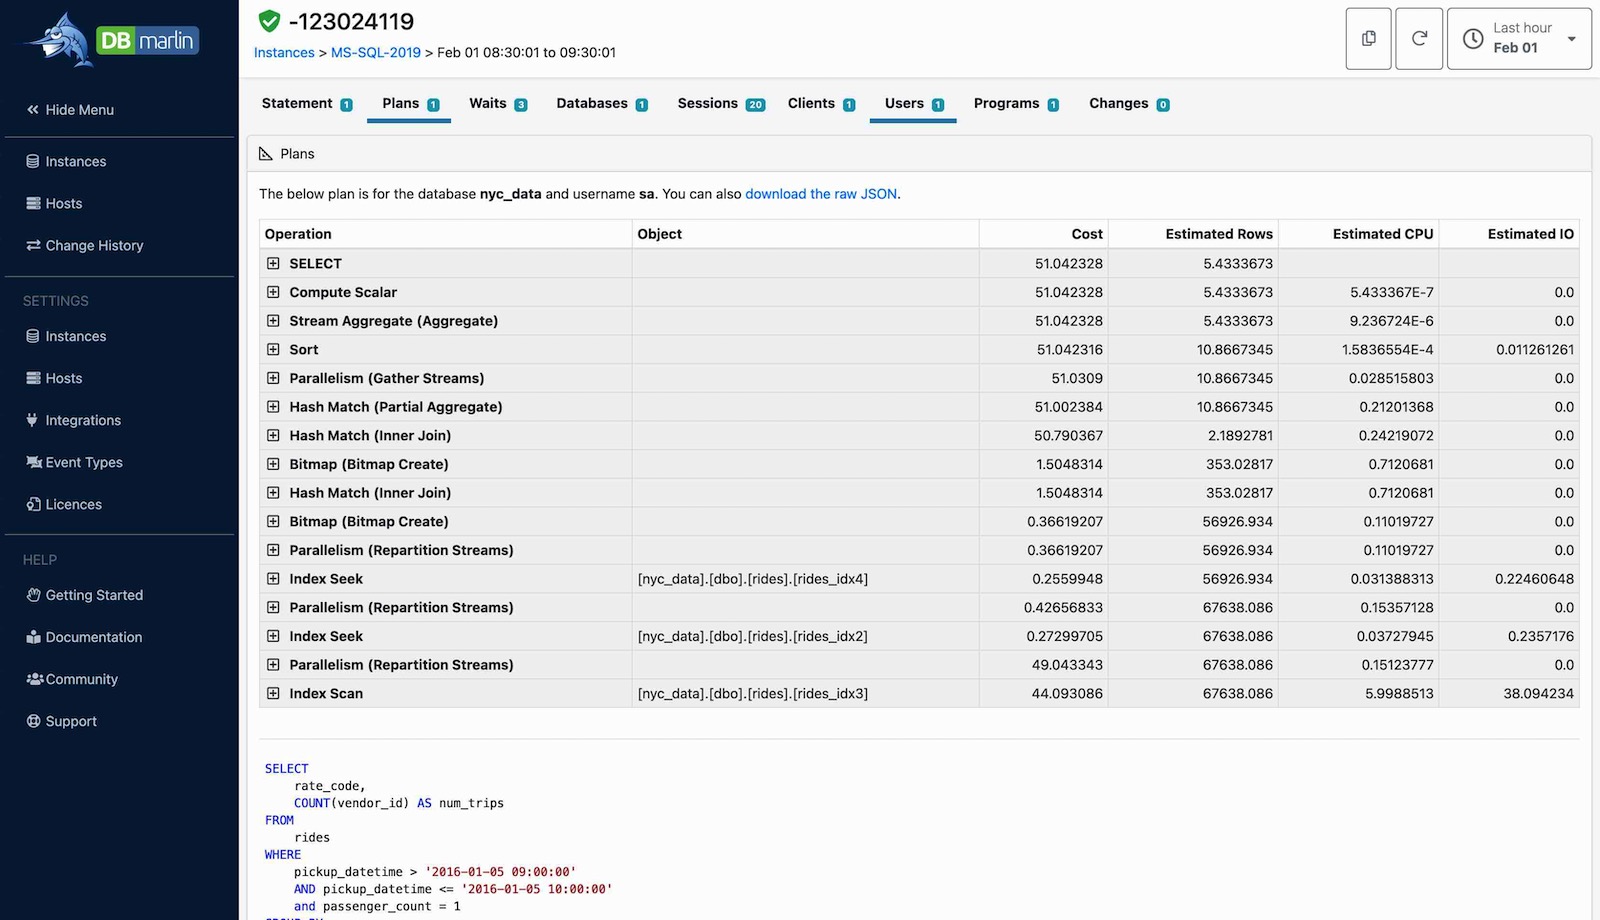
Statement execution plans
Before this release, all of our statement execution plans were JSON formatted text. While valuable and containing lots of useful data, larger statements were sometimes a struggle to read, making any immediate performance bottlenecks hard to analyse.
To help speed up the process of identifying expensive steps of a database statement, we have moved both Oracle and Microsoft SQL Server execution plans into a tabular format, where we now breakdown and highlight the critical steps of your execution plan. From our in-house testing, we’ve seen large execution plans of say 100+ lines of JSON text, now condensed to a small subset of tabular data, enabling you to easily see where the costs are expensive. And don’t worry if you still want all the detail either, rows can be expanded to reveal all of the original detail, albeit in a better-formatted state.
Stability and other improvements
The two new features about are our main achievements but you can read our v1.1.0 release notes for more details. Thanks to our continually growing community and customer base, we’ve received some incredible feedback that we’re taking on board. Your feedback helps shape our solution and highlight the issues and functionality that you want within a database monitoring solution, so please keep it coming. You can send us feedback through our Slack community and if you’ve not yet joined then head to join-community.dbmarlin.com now to get involved.
Work in progress
Our work is never done! We’re already working on the next set of updates. You can expect additional hardware metrics and some comparison reports as well as some exciting-looking UI and UX updates.
Ready to try DBmarlin?
Ready to get hands-on with DBmarlin before deciding whether to try it for your business? We now have a DBmarlin Play site where anyone can see the product with real live data.
We value your feedback, so please don’t hesitate to get in touch!