
Google Lighthouse score, could this be the lowest you’ve ever seen?
We happened upon a website recently, following an unrelated Google search and, out of curiosity, decided to run a Rigor performance test against it, due to its tardy response. The results astounded us, providing us with a new benchmark by which you would not want to be judged! The biggest website homepage we’ve ever seen, which, unsurprisingly, correlated to the smallest Google Lighthouse performance scores we’ve encountered too!
Our first test showed a Google Lighthouse performance score of just six! Then when we checked again the following day things had sadly deteriorated further with a record-breaking performance score of ZERO – yes, a big, fat zero.
Now, we’re not going to name and shame here, as that’s neither fair nor professional. Still, we are going to give some initial, free advice on how this, and plenty of other websites out there in a similar situation, can tackle typical performance issues.
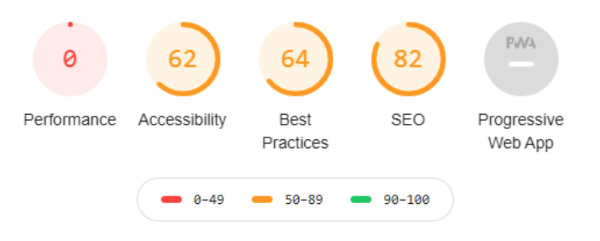
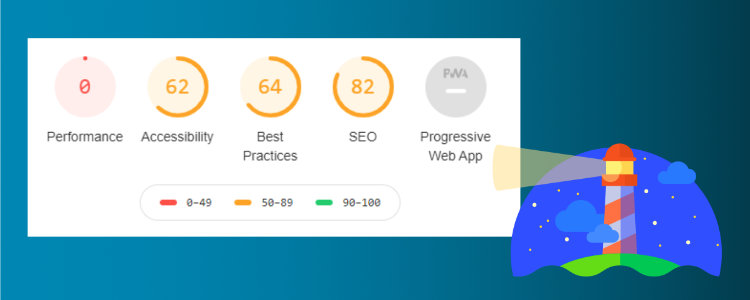
The Google Lighthouse performance score reported by ChromeDev Tools Audit
Be content aware, be size aware
Content is why your website exists in the first place, and it’s what drives visitors to your site. The challenge with content is getting the level right and presenting it correctly via optimised mechanisms. But what does this mean?
Well, for this specific website, their total homepage content size was a whopping 51.6MB. That’s big. We often come across a web page weighing in at 8MB size, of which the majority is made up from third-party content such as adverts, tracking tags etc., but for this site 49.9MB of the material was their own content (referred to as first-party).
The site fell into the typical, easy to fix traps, such as oversized images, videos etc. You can spot these directly in your browser using whatever Developer Tools it may have and using their network tab to see the page resources, transfer timings and sizes. You’ll quickly see the page resource sizes, and see which ones need to be optimised.
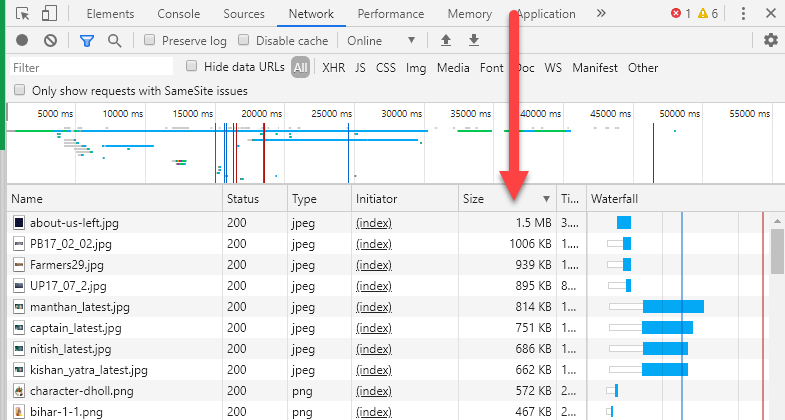
ChromeDev Tools Network showing the top resource sizes for the analysed web page.
You will then need to go through each resource and optimise them for the web. Google has excellent documentation on web performance and the impact of a slow website, and they detail a lot of advice for optimising various image types along with some tools you can use to help optimise images.
If you’re a Rigor customer, all page resources are conveniently categorised in priority order, allowing you to quickly see what resources are impacting your web page’s performance the most. Images can also be hassle-free downloaded in an optimised format direct to your computer. In our example, a background JPG image weighed in at 1.5MB, yet via Rigor, a 31kB WebP version could be downloaded and used instead – that’s a whopping 1.4MB+ or 98% reduction!
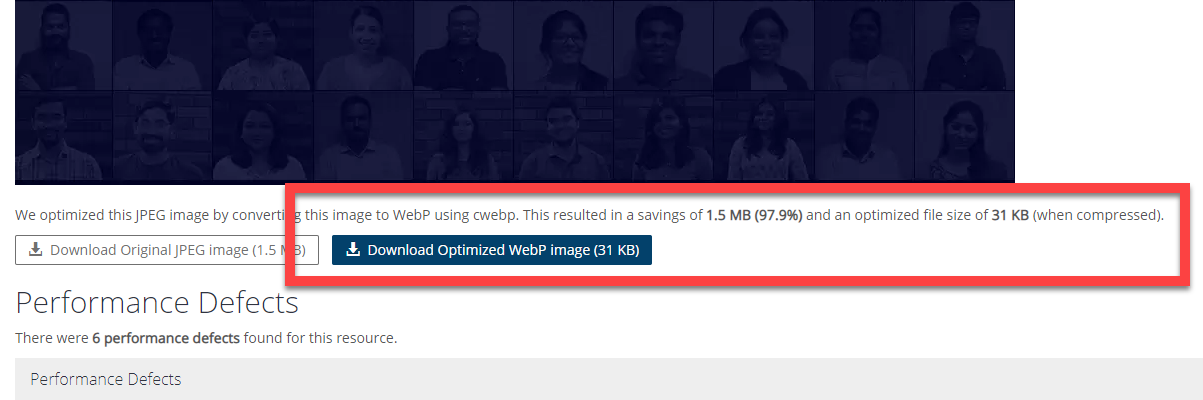
Rigor detects large images and offers performance optimised downloads straight to your browser.
Are you over-serving content?
Web pages do not need to be complicated, and a balance needs to be struck between design vs content vs size, to ensure performance. In our tests, we found the website in question was using anywhere between 600-800+ resources to build its page content, and depending upon what these resources do and when they are loaded within the page lifecycle, can degrade page performance.
Again, you can use your favourite web browser tools to review waterfall charts, and see what resources are requested at what stage within the page. In this example, 79 resource requests were made consisting of images, various JavaScript frameworks and CSS before the page start render event. One small saving grace for this website was the use of HTTP/2; without HTTP/2 I suspect the site would be unbearably slow [want to know more about HTTP/2, its benefits and how it compares to HTTP/1.1?].
You should review what resources are getting loaded and when – are they really required and if so, could the page resource be loaded later within the page lifecycle? Be aware of duplicate or overlapping third-party tags too, as these can also impact page load times – we completed a recent website performance review and found three different RUM implementations from various suppliers that nobody at the client company knew about (and yes, they were paying for all three tools!).
Know your performance metrics
As a web developer, you should know the critical web page performance metrics, what they mean and, as a team, you should decide on which ones to measure yourselves against and set target performance budgets and SLAs to help map your way to success.
We’re not going to list all the available metrics, Rigor has a great blog covering metrics further, but here are just three web performance metrics used by industry-wide tools and performance companies such as ourselves.
First up is “First Contentful Paint” which represents the time it took for the page to render the first bit of content within the visitor’s browser. Then we have “First Meaningful Paint”, and this represents a key render event such as a hero or product image above the fold, meaning the user sees the render take place. “Time to Interactive” is another useful metric to measure against, as this represents the time at which the visitor should be able to use, click around and interact with your website.
For the website in question, we see some very high values. Rigor reported a “First Contentful Paint” taking 9.17s, “First Meaningful Paint” at 9.52s and “Time to Interactive” a miserable 12.63s.

Everything mentioned in this article is possible via most web browser developer tools, and Google Lighthouse is another free tool that you can use to help analyse your page performance and receive some advice on what performance bottlenecks your site is suffering from. Rigor is an additional tool you can use to receive direct, prioritised advice and feedback on your website performance, enabling you to get to the root of an issue, reducing your MTTR and enabling you and your developers to concentrate on delivering functionality.
If you are worried that your website is slow and are not sure what your next move should be, talk to us. We are always happy to have a friendly chat and provide advice without any commitments. And should you need monitoring or optimisation tools then we can certainly help with that too!